The Organization Chart
Overview
The organization chart shows your organization as it is set up in RosettaHub: its departments and teams as sub-organizations, its projects, the people in each, and their cloud accounts on every cloud. Each box shows what it has spent, against its budget where it has one, so you can see at a glance where the money goes and who is close to their limit.
It is part of RosettaOps. You need to be an organization administrator or manager to see it.
Prerequisites
- [ ] A RosettaHub account with an administrator or manager role in an organization
Explore the chart
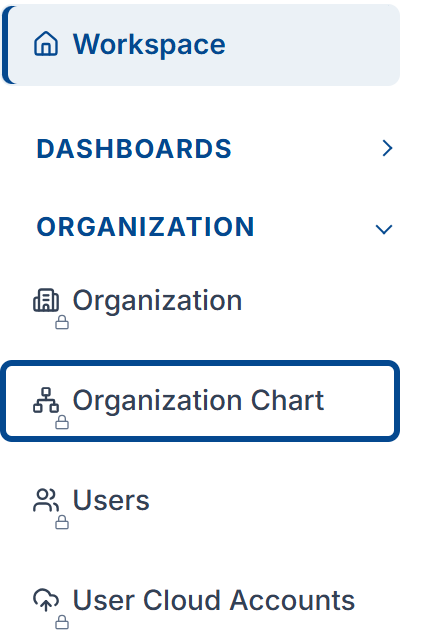
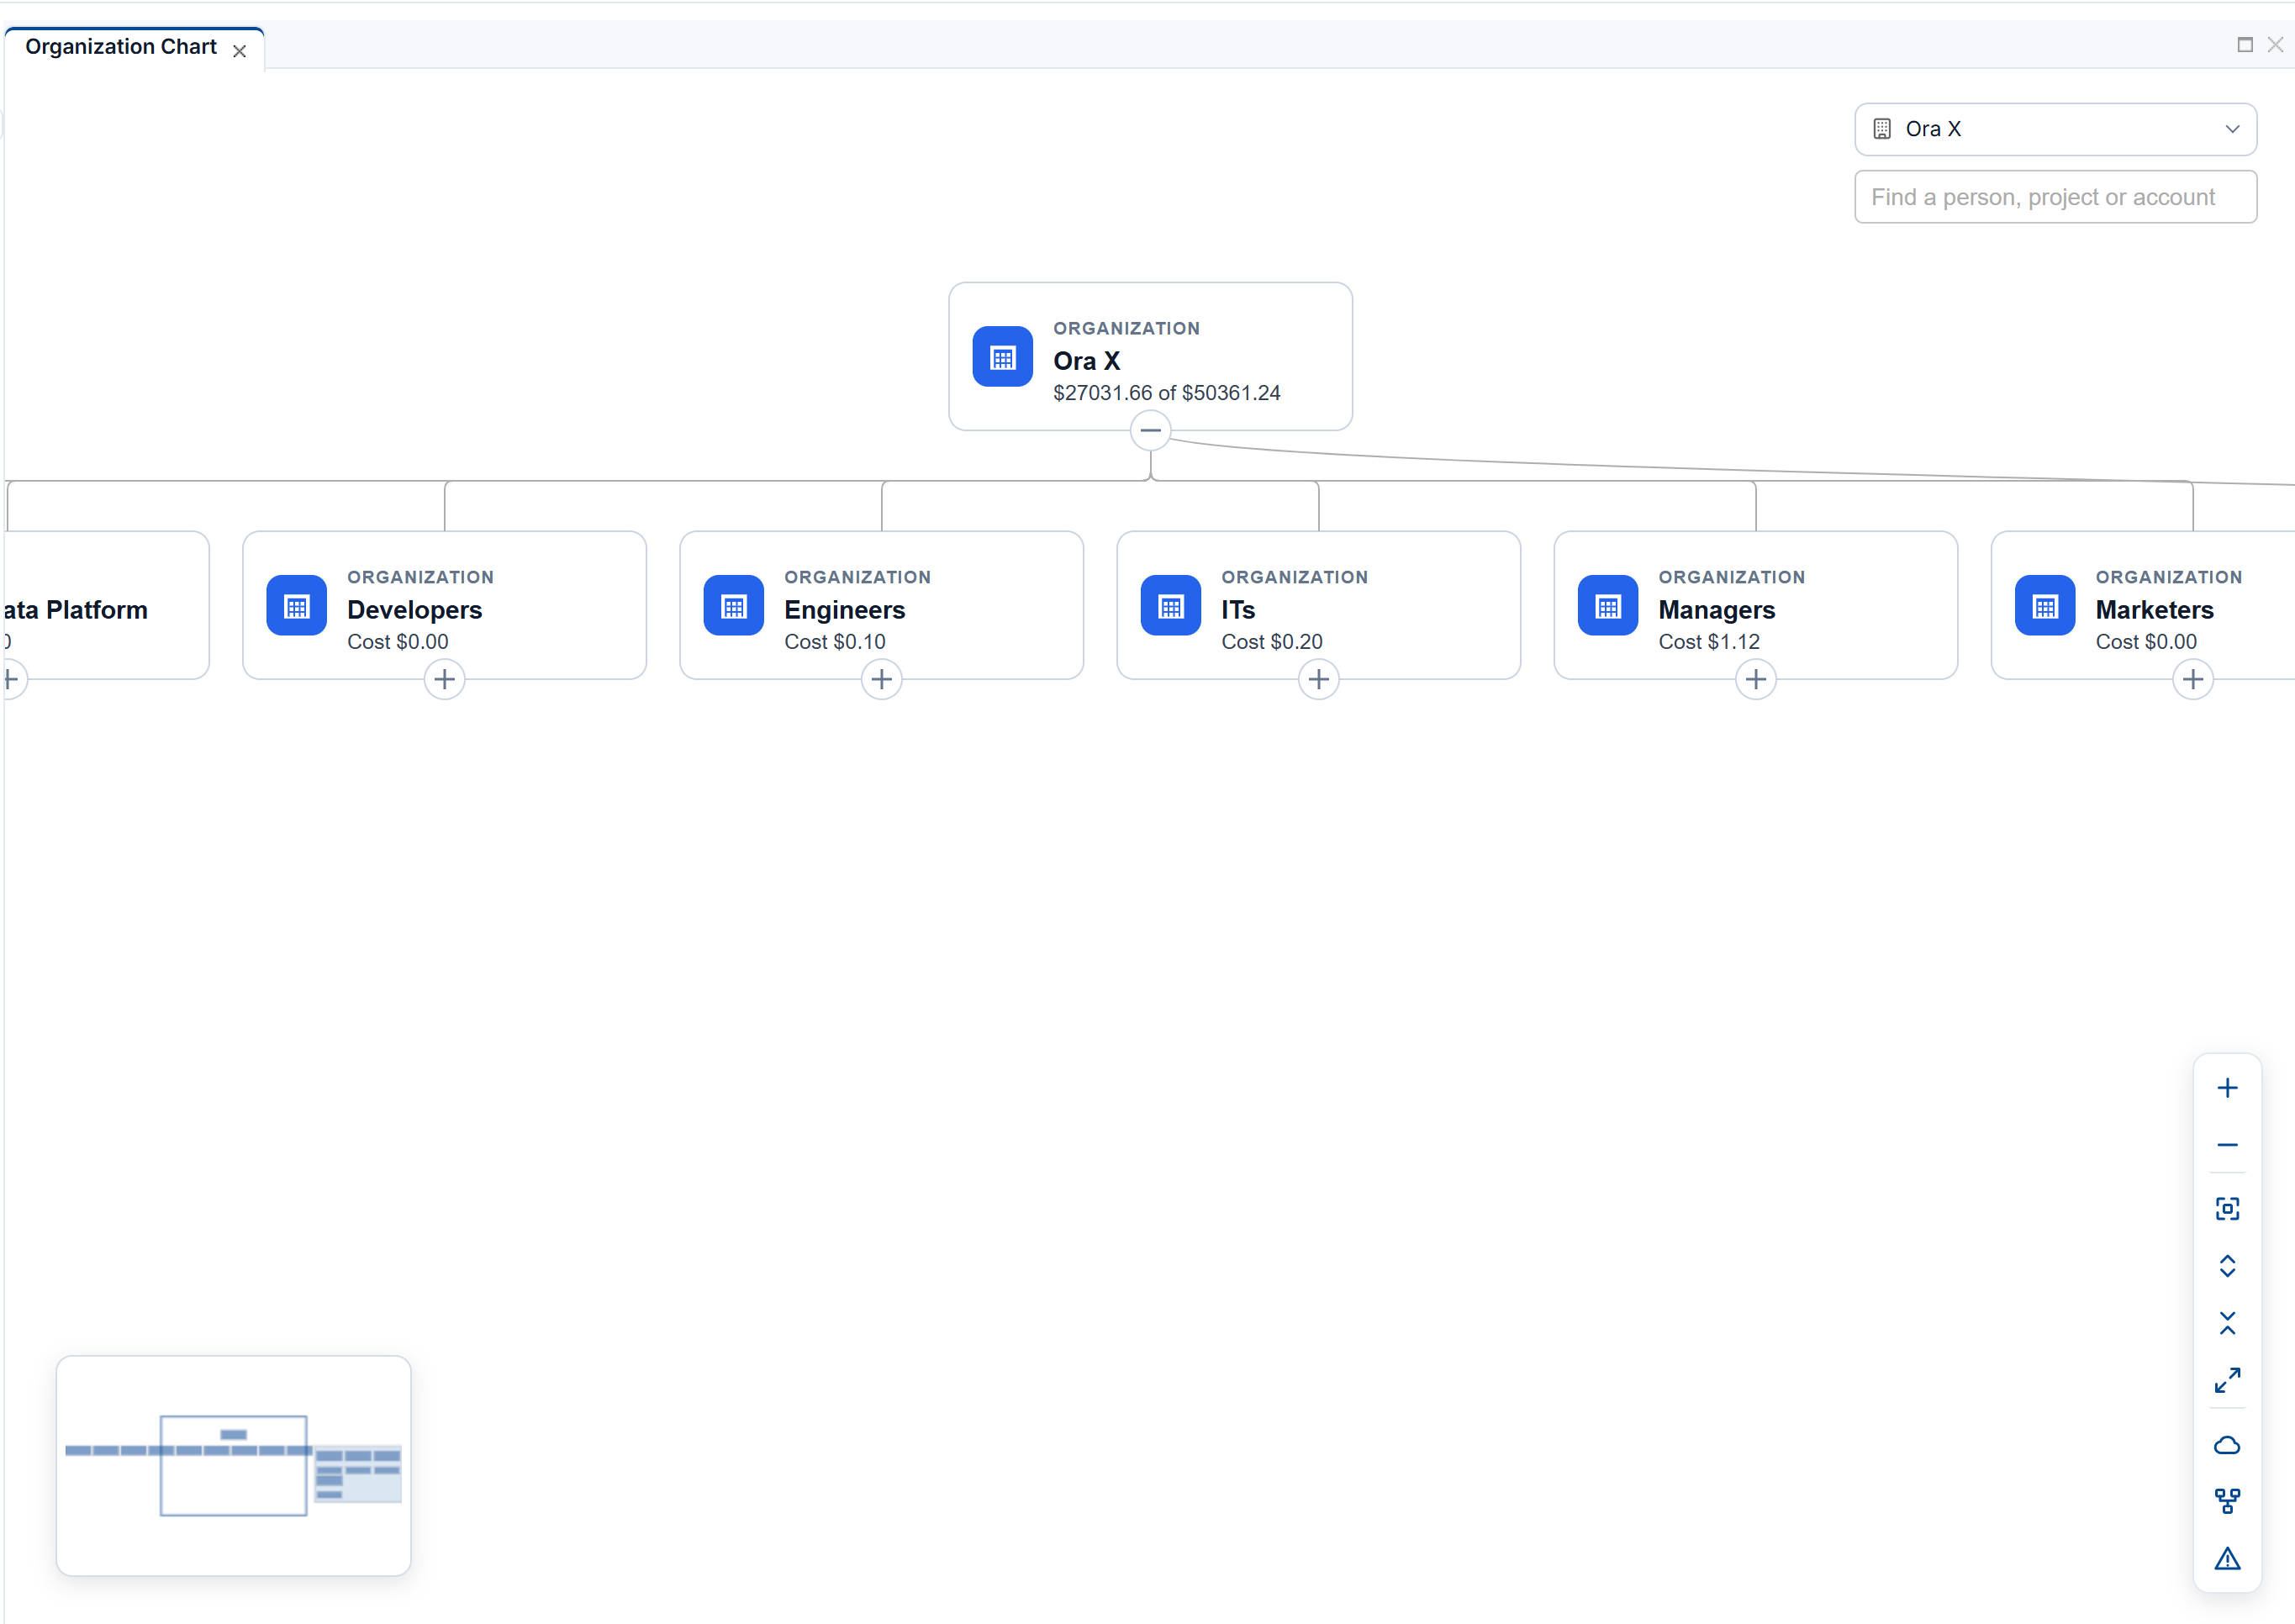
Read the top level
The chart opens on your organization with its first level: sub-organizations and projects, each with its type and cost. Choose another organization you manage with the picker at the top right, or type in Find a person, project or account to go straight to one.
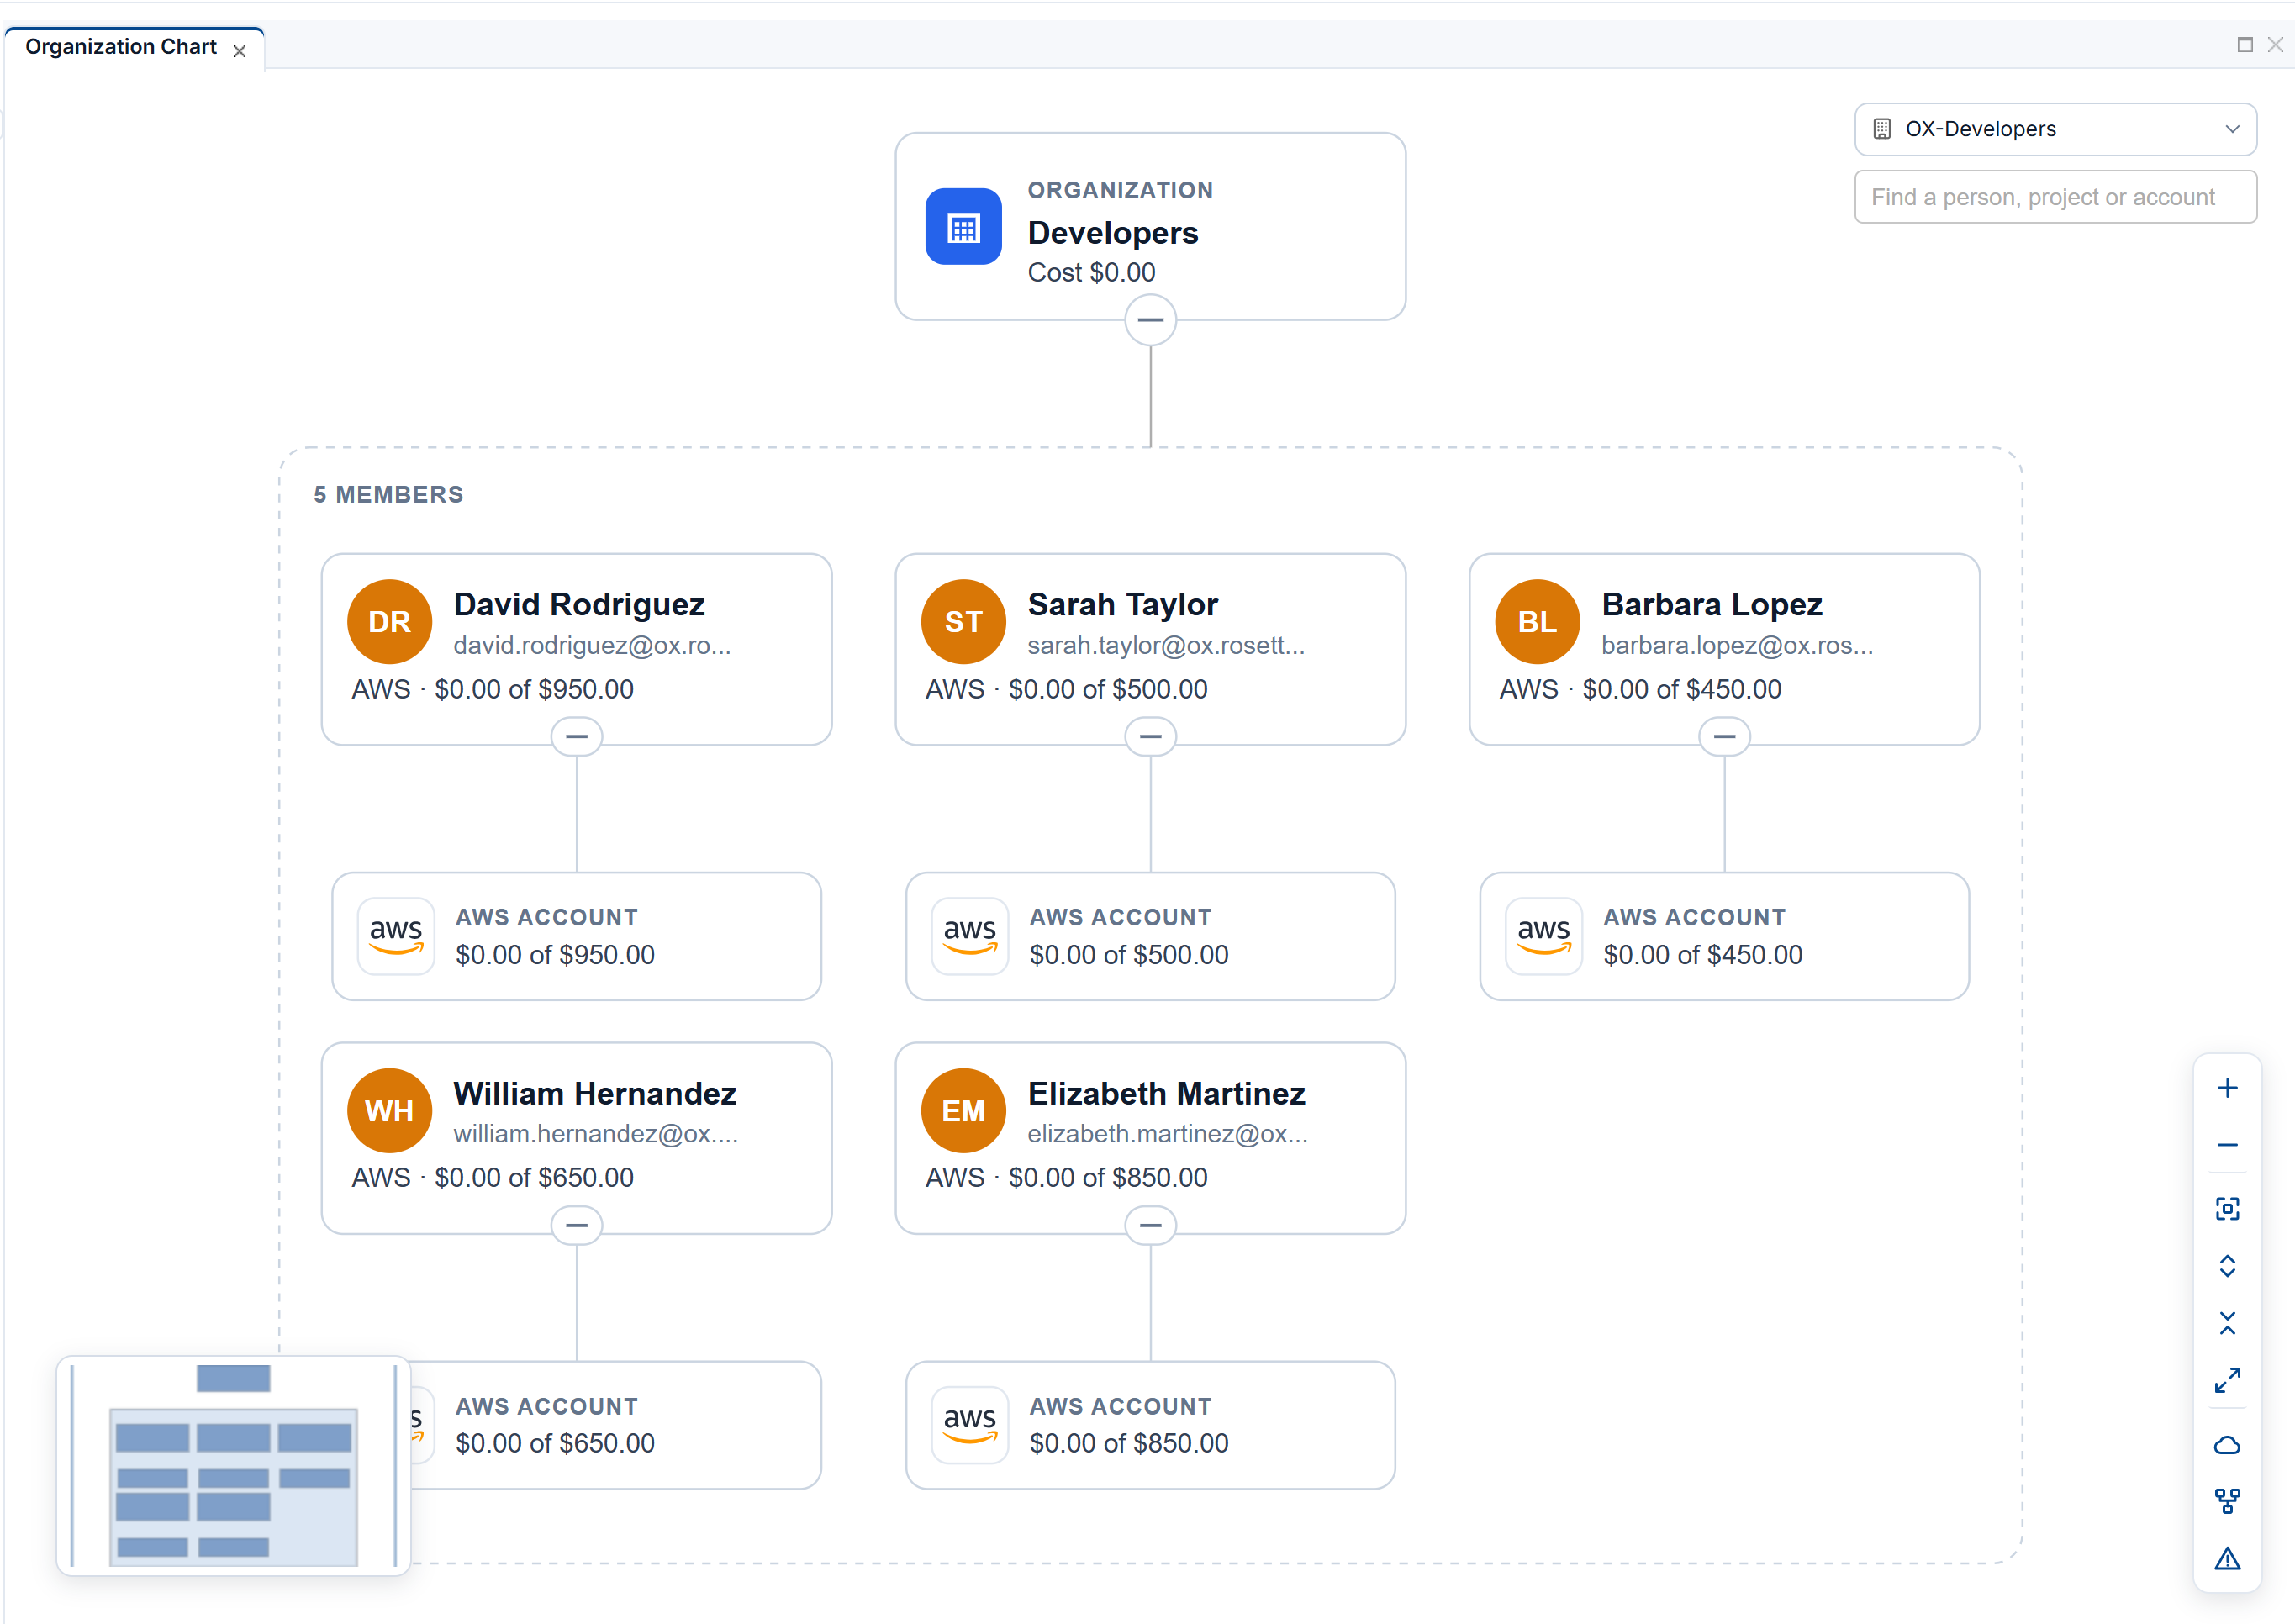
Unfold it
Click + under a box to open it, or use Expand all, down to cloud accounts in the toolbar on the right to open everything. On a large organization, pick one team in the picker first, such as Developers here, so the cards stay readable. People show their email and how many cloud accounts they have; each cloud account shows its cloud and what it has spent of its budget. A disabled account is outlined in red.
The toolbar also zooms, fits the chart to the screen and folds it back.
Act from the chart
Click a box for its details; rest the pointer on it for a summary. To act on what you found, right-click it in its view under ORGANIZATION: Organizations, Projects, Users or User Cloud Accounts. See Budgets and Costs for budgets and Guardrails for permissions.
Next Steps
- Budgets and Costs: follow spending and move budget where it is needed
- Guardrails: decide what each organization may use
- Organizations: how organizations and projects work